Taking Defensive Insights from the Data Hub
In a previous piece, we touched on the attacking insights you can take from Football Manager 2022’s brand-new Data Hub.
As Football Manager players, we usually put a lot of thought into our tactical approach. Not just the formation, the player roles and the instructions, but also how and when to press the opponent (enhanced by FM22’s new pressing system), if we should pass short or long and if certain roles should principally Defend, Support or Attack. It’s a beautiful thing when you are winning but it can be a nightmarish puzzle to solve when you are on a losing streak.
The rapid rise of the popularity of analytics in football is now reflected in-game through a variety of useful visualisations in the Hub. You can maximise this feature to give you deeper insight into how your team are playing in every phase of play and in every part of the pitch.
Historically it can be difficult to figure out exactly where things are breaking down, but FM22’s new Data Hub can empower you to easily see some of these challenges and tweak your tactic to get more from your system and your current players. It’s worth bearing in mind that the better analysts you have, the more information you’ll have to play with.
In this second part of his series, FM Stag explores how you can obtain key Defensive Insights from the Data Hub.
Managing Huddersfield – An Example
My Huddersfield side are currently 20th in the Sky Bet Championship, hovering dangerously above the relegation zone after 20 games. We’ve conceded 45 goals, which is incidentally 20th in the Goals Against table too. How do we stop leaking so many goals? If we concede fewer goals, we should win more points…
Pre-Data Hub me:
Our Centre Backs should really be aerially dominant. I think that’s how best to defend attacks in this division. I think that we need Central Defenders with higher Jumping Reach and Heading Attributes. I remember a few highlights where one of our Central Defenders missed a header as the ball dropped and let the opposition striker in behind. That must be it. Let’s go and get a pair of new (giant) defenders in the next window. Otherwise, we risk losing even more matches.
Also, our goalkeeper must be awful. He’s the one letting in the goals and he’s letting in too many. We need a better shot stopper, that’s the long and short of it. So, let’s add a new keeper to our mid-season shopping list and that’ll fix things.
Data Hub me:
Navigates to the Data Hub, clicks ‘Ask For’ and looks at a handful of excellent visualisations from my Performance Analysts that will give me real insight instead.
Let’s first look at our Aerial analysis and see if my gut feeling was right.
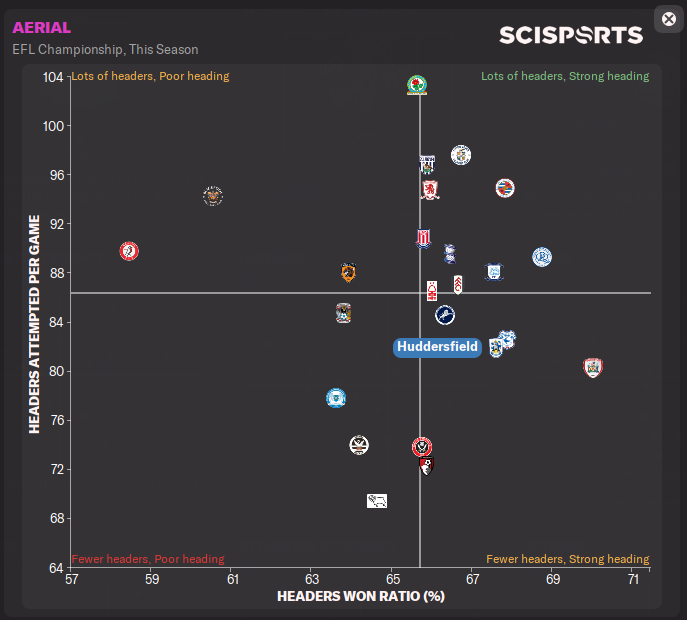
Interesting. We actually win more of our opportunities to head the ball than the average team in the league, sitting as the fifth most effective headers of the ball in the league. In fact, looking at this visualisation, only four teams (Cardiff, Reading, QPR and Barnsley) successfully complete a higher percentage of headers than we do.
Perhaps, with that in mind, our biggest problem is my other gut instinct issue, our first-choice goalkeeper. Let’s look at the Advanced Goalkeeping visualisation on the Data Hub > Player screen to see how he compares with his peers.
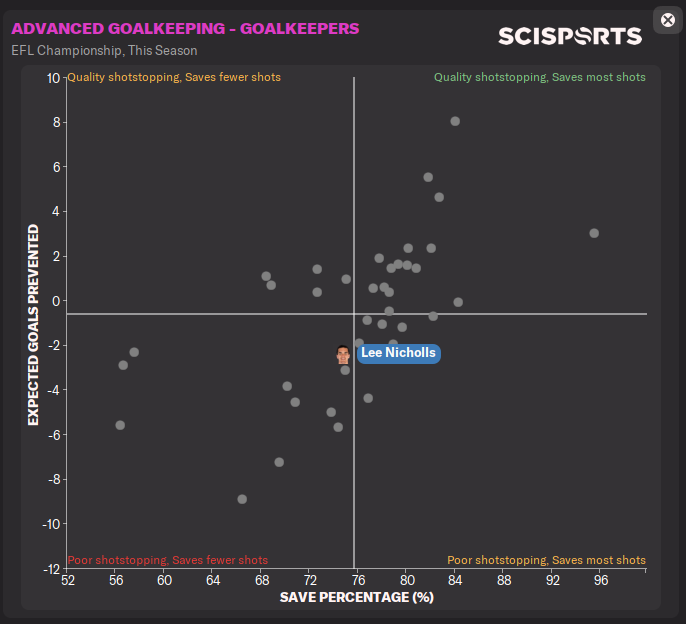
Ok, so that isn’t it either. Lee Nicholls is successfully saving almost exactly the average number of shots aimed in his direction of all the goalkeepers in the Sky Bet Championship. Looking at this visualisation, his approximately 76% successful Save Percentage ratio puts him right in the middle of the pack. When we look at the vertical metric on this graph, he has only conceded two more goals than his Expected Goals Against suggest.
Looking at those two Scatter Graphs alone, the problem is neither our aerial ability, nor the shot-stopping ability of our goalkeeper. We could be performing better, but by these defensive metrics we should be comfortably mid-table, not facing the dreadful prospect of a relegation battle.
What else can we look at to see what the problem could be then?
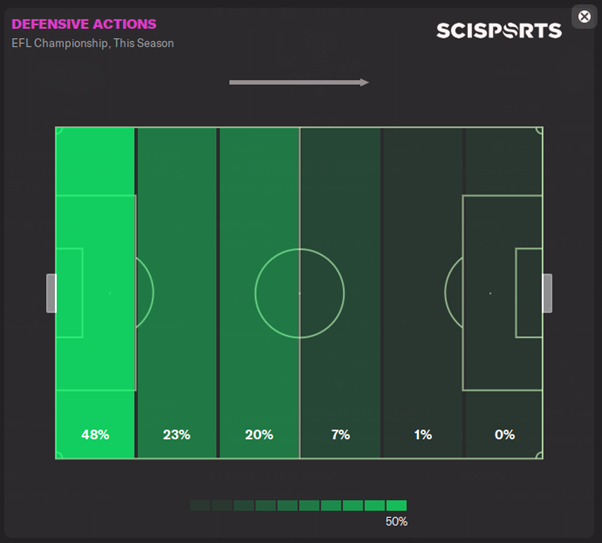
Now I see something. A quick glance at the Defensive Actions Zone Map and clear issues are starting to surface. An incredible 48% of our Defensive Actions, such as tackles, blocks or interceptions, occur in the immediate sixth of the pitch nearest our own goal.
Only 8% of our presses (or blocks or interceptions) happen in the opposition half and only 1% in the final third.
Is there any other insight we can glean from elsewhere?
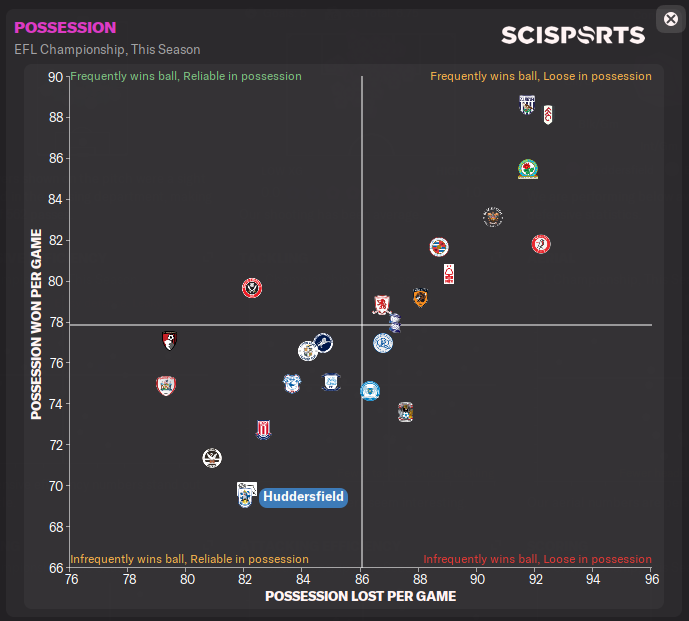
Looking at the Team Possession graph we can see that we are, statistically, the worst team in the division at winning back possession. While relatively reliable at keeping a hold of the ball when we actually have it, we very rarely win it back.
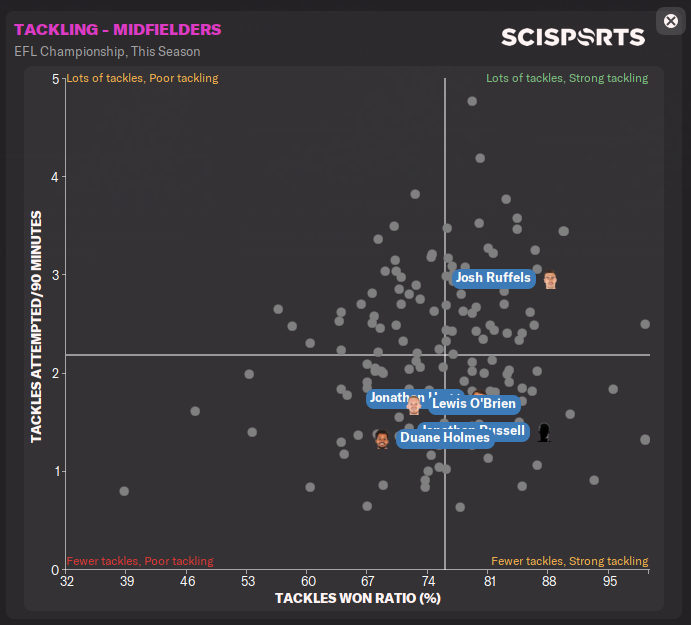
Also worth consideration is the Tackling – Midfielders chart, which shows me that our regular midfield players attempt A LOT fewer tackles than the average midfielder in the Sky Bet Championship. Josh Ruffels is the outlier here but he is seemingly trying to defend all on his own.
What insight does all this give me?
It wasn’t our aerial prowess or our goalkeeper’s deficiencies. The reality is that we don’t win the ball back often enough, don’t press in the opposition half and regularly rely on last-ditch defending really close to our own goal line.
Maybe before spending money on new defenders and a goalkeeper, it’d make sense to incorporate some tactical tweaks and shuffle our player selection instead. It can’t hurt.
We already play a slightly higher defensive line, so the last-ditch tackles are not a result of the team sitting too deep. That said, we were using the Team Instructions to Play Out From the Back and Distribute the Ball to Central Defenders. Let’s not do that anymore. Clearly, we are inviting the press, losing the ball regularly enough to concede chances, and this is leading to almost half of our Defensive Actions being within 30 yards of our own goal line.
Jordan Rhodes has been our lone striker. While still a deadly Poacher with some excellent qualities, his limited Pace and Work Rate means that the game is passing him by. Maybe a gifted Poacher is a luxury we can’t currently afford in our current position. While not as clinical as Rhodes, Danny Ward is quicker and boasts higher Work Rate and Teamwork Attributes. He would make an ideal Pressing Forward. If we press from the front with more efficiency, in theory we will take the battle for possession higher up the pitch, further away from our danger zone. Therefore, conceding fewer opportunities that lead to goals.
In Summary
Data alone cannot win football matches. There is no instant win formula in Football Manager, in the same way that the result of a football match in real life can be truly unpredictable and based on emotion, desire and all the other intangibles that make us love football.
That said, figuring out in a few clicks exactly where my tactic seems to be breaking down and giving me knowledge of how I can improve it without tearing it all up and starting again?
That’s insight. That’s powerful. That’s realism.
I have only touched on a couple of the many available visualisations available in the Data Hub with this Defensive Insights article but there are lots of options for you to explore in more detail.
What will you use your Data Hub for?
Keep an eye out for further Data Hub articles, for example exploring how to use it as a scouting tool.
Happy managing,
FM Stag