


Join the Squad Get Rewarded
Unlock early access to FM feature drops, news and reveals before anybody else. Plus, behind-the-scenes insights and incredible members-only giveaways.
Sign for FMFCAlready a member?

We’ve detected that your browser is in English, click the button below to go to the dedicated English version of the Football Manager website.
Go to English site
Hemos detectado que tu navegador está en español. Haz clic en el botón de abajo para ir a la versión del sitio web de Football Manager en este idioma.
Ir al sitio web en español
Nous avons détecté que votre navigateur est en français, cliquez sur le bouton ci-dessous pour vous rendre sur la version en français du site internet de Football Manager.
Allez vers le site en français
Tarayıcınızın dilinin Türkçe olduğunu belirledik. Football Manager web sitesinin Türkçe versiyonuna gitmek için aşağıdaki düğmeye tıklayın.
Türkçe sitemize gidin
Abbiamo rilevato che il tuo browser è in italiano, clicca sul pulsante qui sotto per andare alla versione italiana del sito di Football Manager.
Vai al sito italiano
Wir haben erkannt, dass Ihr Browser auf Deutsch eingestellt ist. Klicken Sie auf die untere Schaltfläche, um zur deutschen Football Manager-Seite zu gelangen.
Zur deutschen SeiteAdd to wishlist now to get launch alerts straight to your inbox.

In two previous pieces, we touched upon the attacking and defensive insights you can take from Football Manager 2022’s brand-new Data Hub.
As Football Manager players, we usually put a lot of thought into our tactical approach. Not just the formation, player roles and instructions, but also how and when to press the opponent (enhanced by FM22’s overhauled pressing system), if we should pass short or long and if certain roles should principally Defend, Support or Attack. It’s a beautiful thing when you are winning but it can be a nightmarish puzzle to solve when results aren’t going your way.
The rapid rise in popularity of analytics in football is now reflected in-game through a variety of useful visualisations in the Hub. You can maximise this feature to give you deeper insight into how your team are playing in every phase of play and part of the pitch. This insight can help you not only identify gaps in your team’s performances, but subsequently identify who might be a good transfer target to come in and fill those gaps in your squad.
In this third part of his series, FM Stag explores how you can leverage the Data Hub to identify appropriate scouting targets from within your division to address potential tactical problems.
My Bournemouth side have just finished the SkyBet Championship season in third position, narrowly missing out on automatic promotion to the English top-flight by a point.
Play-off heartache against Blackburn Rovers was followed by the reluctant acceptance that we need to buckle up and settle in for another year in what’s widely considered the most competitive league in the world.
Let’s use the Data Hub to see where it went well for us this season, but more importantly where it might have gone wrong.
If we can identify our issues and then iron them out through clever player recruitment, we might be closer to promotion than we think.
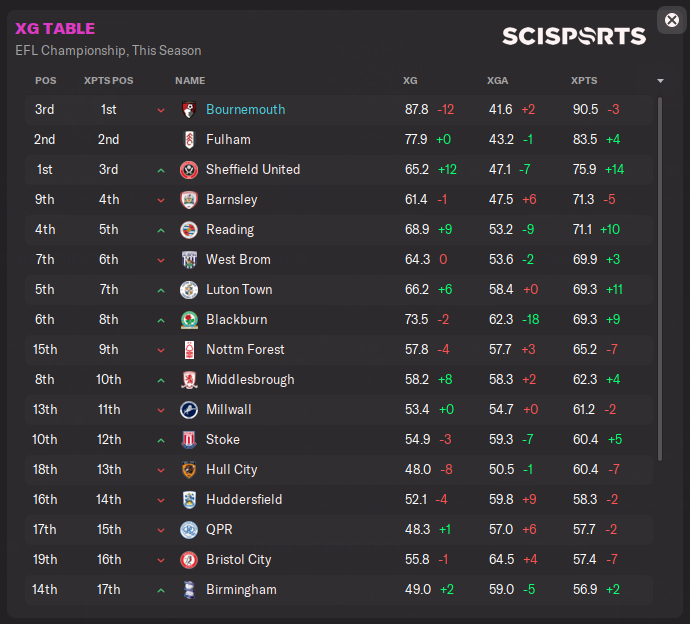
First things first, the xG Table in the Data Hub’s Team page will tell us if our results reflected the quality of our performances.
Now that is frustrating.
According to our xG performance the season, we should have finished in first and secured not just promotion but the outright title. From this one screen, it’s easy to see a massive part of our problem. We scored 12 fewer goals than expected, based on the quality of our created chances. Sure, we conceded two more goals than we should have done, but 12 under the expected number of goals scored is a clear underperformance.
Overall, this meant that we captured three fewer points than we deserved, and with Fulham and especially Sheffield United’s incredible overperformance happening elsewhere in the league, it seems that our profligacy in front of goal let us down badly in the end.
There is something else that I’ve noticed from the xG Table. While Sheffield United and Blackburn Rovers ended up going up along with Fulham, what were Reading and Middlesbrough doing in attack that made them so clinical as to notably overperform their expected goals? More on that later.
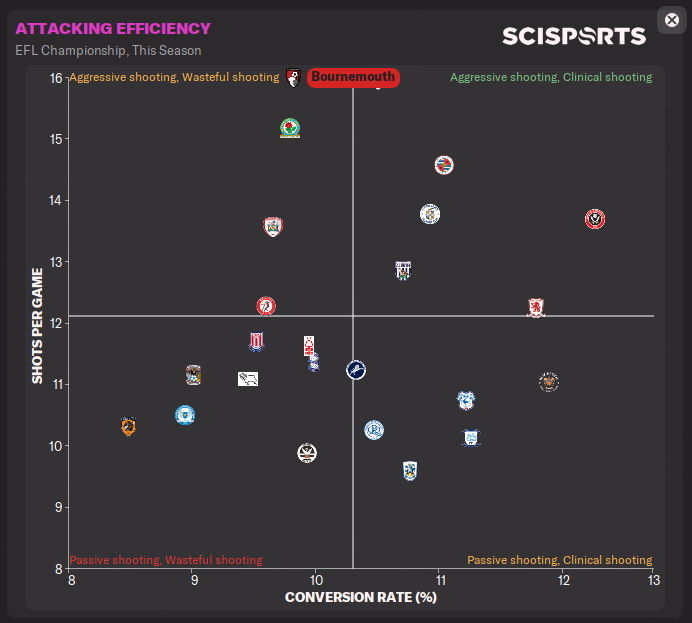
Looking at the Team > Attacking Efficiency visualisation confirms my suspicions. We created a ton of goalscoring chances. In fact, we created more opportunities to shoot than anyone else in the division but converted less than 10% of those chances. There were 15 sides with a better shot to goal conversion rate than us. That’s not promotion form, is it?
That’s one factor noted down, but let’s see if there are any other insights we can gain from the Data Hub’s Team page that may hint at needing improvement before we head to the Player page.
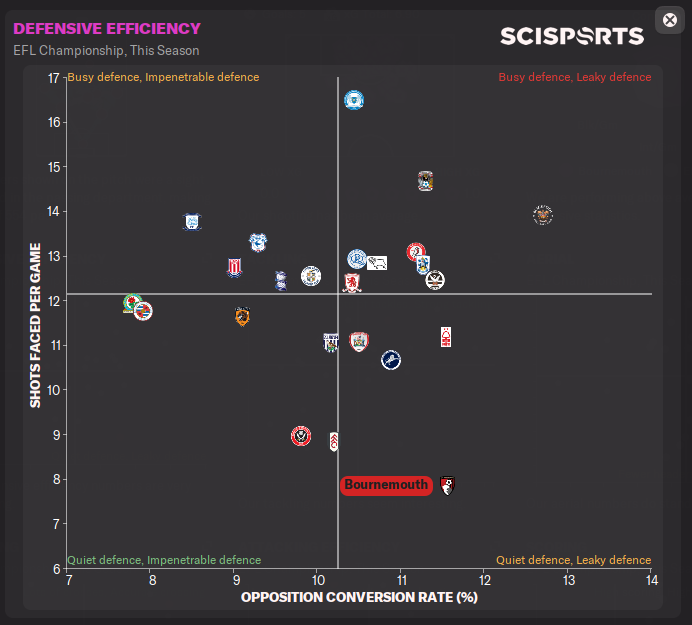
A quick look at the Team > Defensive Efficiency scatter plot identifies another issue. While we managed to concede the fewest shots per game of any SkyBet Championship side, we allowed the opposition to convert a higher percentage of these chances than everyone bar Blackpool, who narrowly avoided relegation. This suggests that while we did a good job of preventing the opposition from getting many shots off, the shots they did get were of a better quality and errors from our backline and possibly our goalkeeper led to conceding more often than we would like to.
In this instance we’ll focus on solving our attacking problems but those defensive challenges are also worth considering.
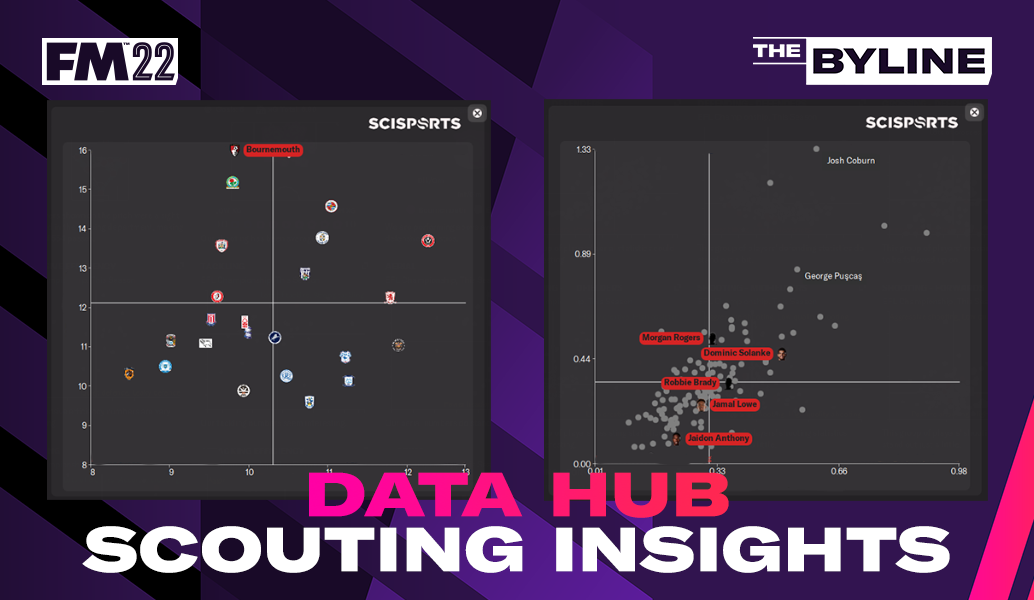
Now let’s take these insights with us to the Player page of the Data Hub and see if there are any players in our division who we could look at signing to solve this problem. Recruiting from the clubs around you using data irons out the issues you’ve identified from the season before and tangibly weakens your rivals, which is a big win-win.
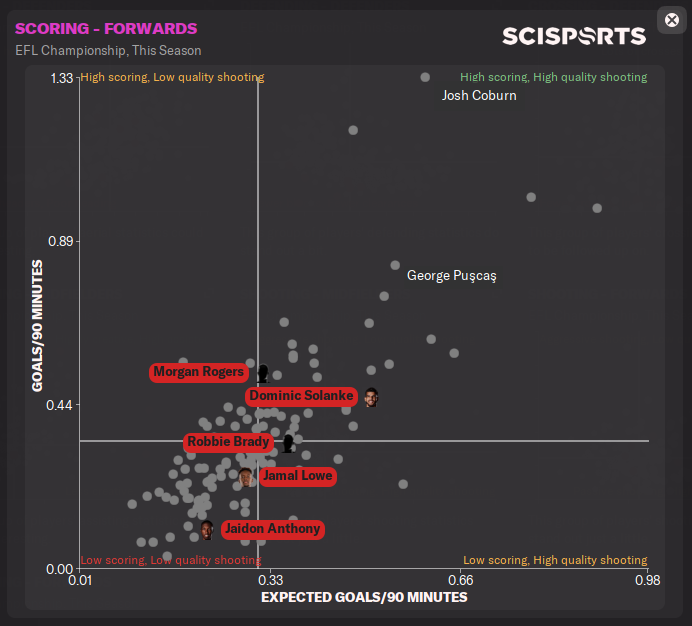
As I feared, we only had one player in the quartile of the Scoring - Forwards plot we’d like our attacking players to be in, and that was Dominic Solanke. The nearer the top right the dot is on this visualisation, the higher quality and more regular chances the player had per game, and the higher number of goals they scored per 90 minutes too.
Remember I mentioned Middlesbrough’s impressive xG over-performance earlier?
I’ve highlighted a player right at the very top of the plot, Middlesbrough’s Josh Coburn. He is clearly performing much better in both of those per 90 minutes metrics than anyone we currently have in our squad.
Looking closely at Coburn it’s clear that while he played much less often than our main man Dominic Solanke, he still featured in 17 matches during the season. Most of those appearances came from the bench but his return of seven goals from just 563 minutes of SkyBet Championship football sounds promising.
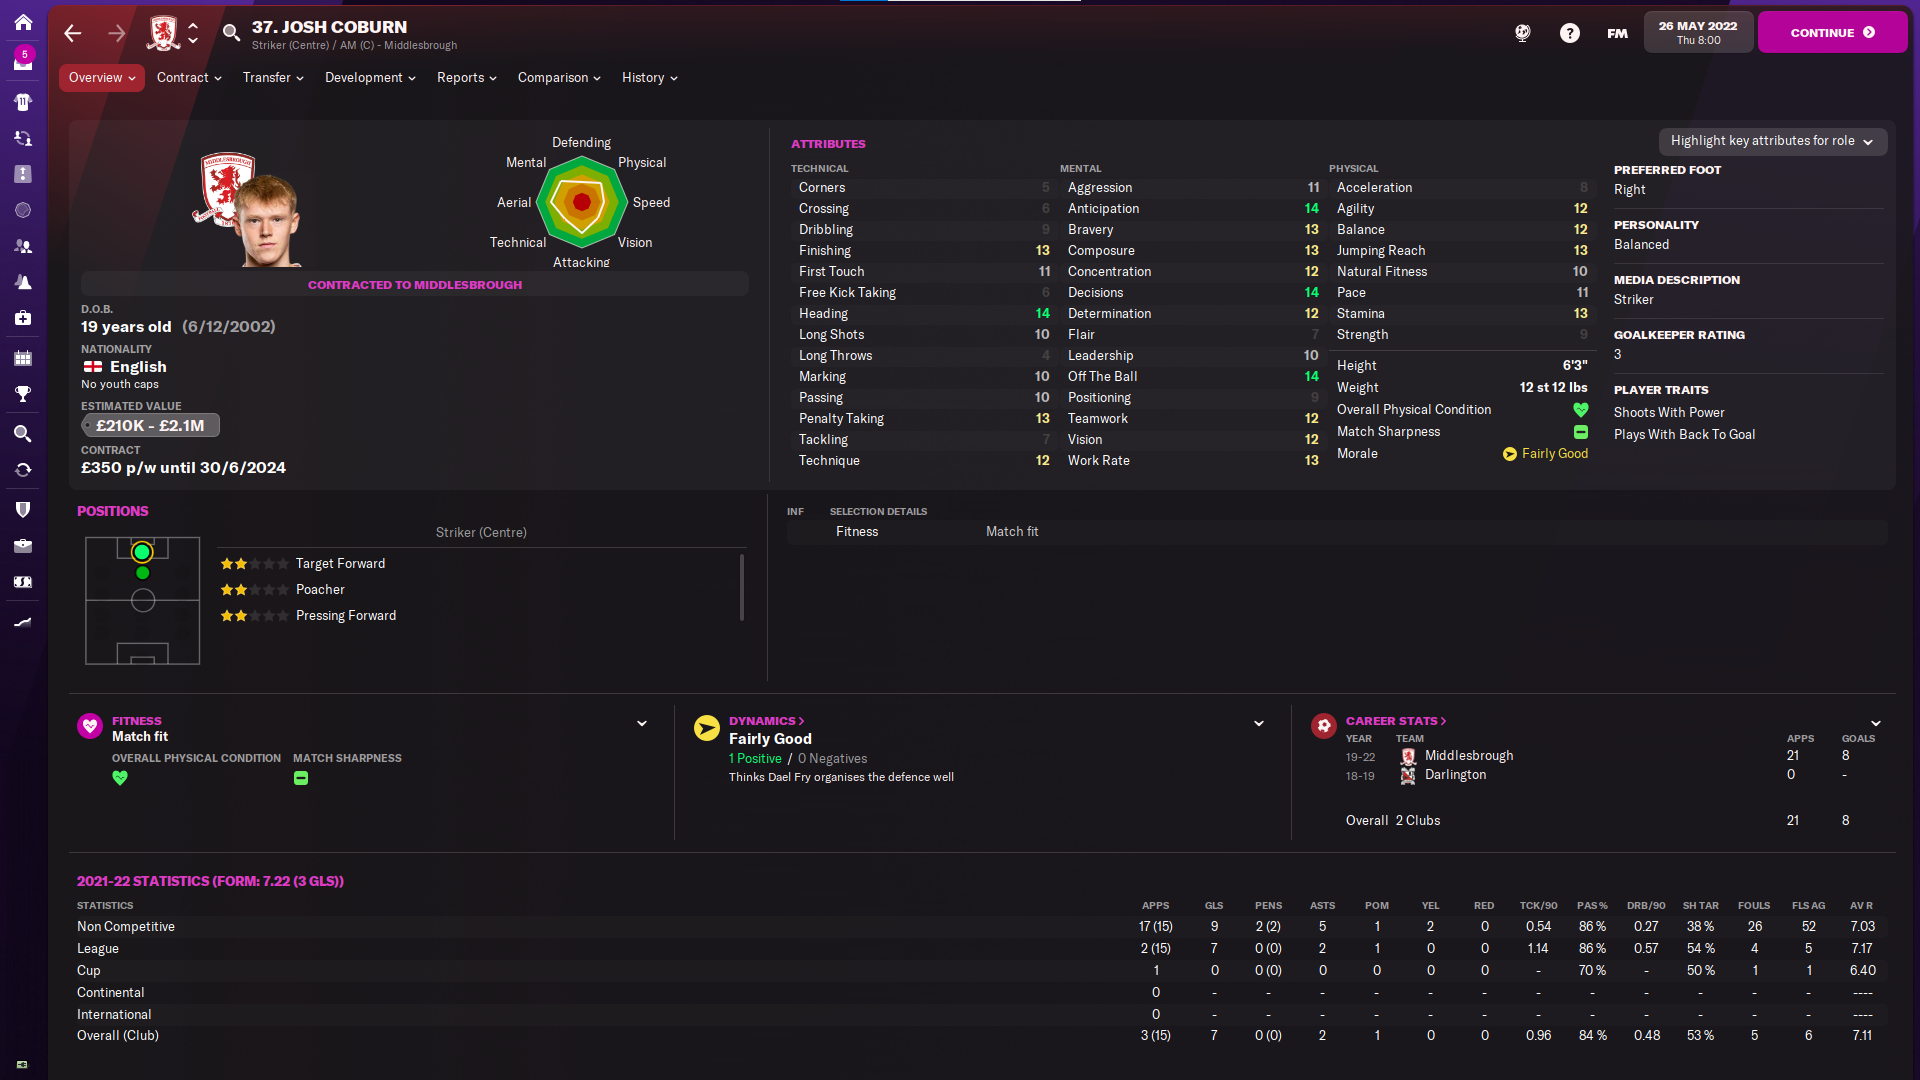
I think he’s worth a closer look and assigning a Scout to ahead of making a move. He’s only 19, so in theory is only going to improve, and should easily be within our budget to buy. If he can be as clinical as he has been in his Middlesbrough appearances so far, he could be just the striker we need to keep Dominic Solanke on his toes, or even push him for a first team place.
The other team I mentioned earlier that had scored significantly more than their expected goals this season (thereby suggesting a clinical forward line) were Reading.
I’ve also highlighted Reading’s George Puşcaş on the Scoring – Forwards plot above, and for good reason.
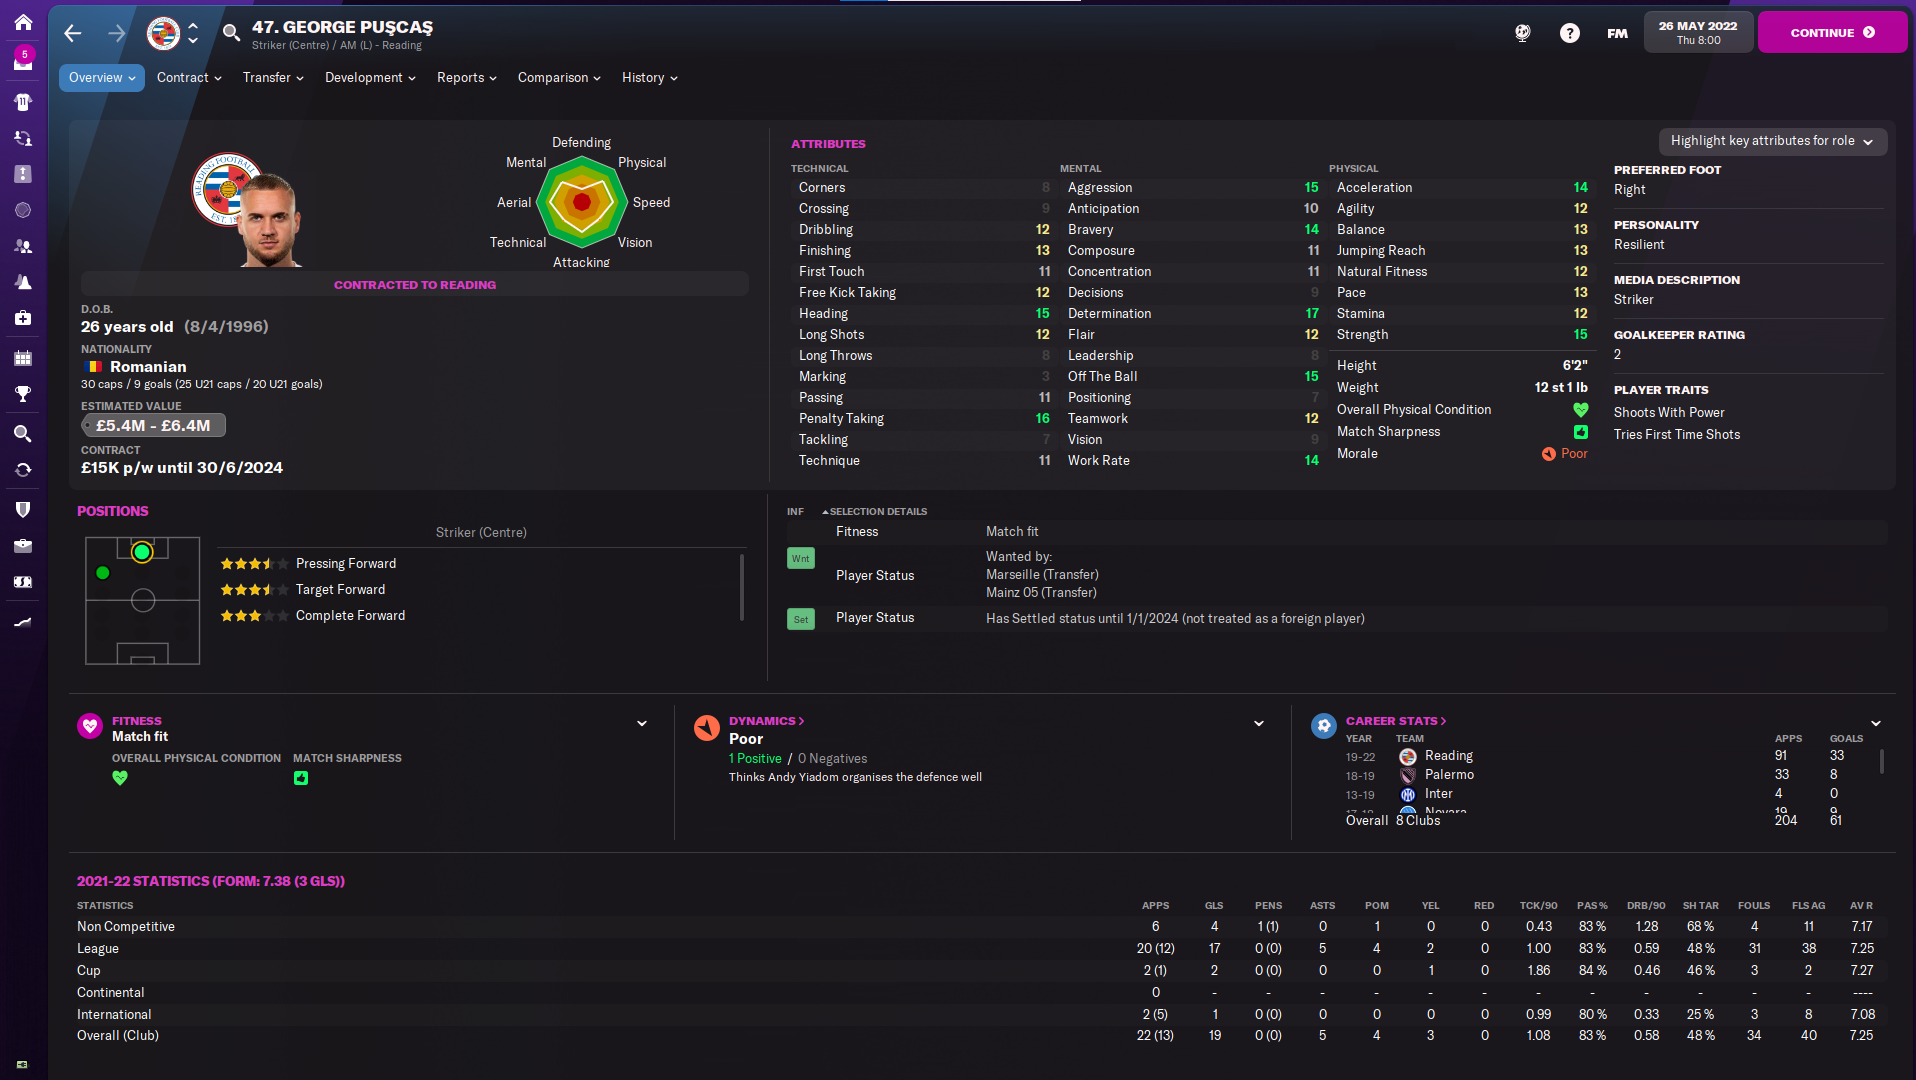
Just like Coburn, Puşcaş notched a higher xG and goals scored per 90 than any of our current forwards. Upon closer inspection, he is playing regularly, is entering his prime years at 26-years-old and has a few European clubs sniffing around him already. Puşcaş’ attacking prowess can safely be considered a major contributor to Reading’s attacking over-performance this season, and that’s clearly why he’s in demand. I’m sending a scout his way too, as I’d much rather have him in my side for Bournemouth than play against him (again) next season.
For this article, I solely focused on using the Data Hub to identify domestic targets who could solve our attacking problems in this particular point in time in this save, but the same principles could be used at any time and applied to a variety of challenges.
Why not try and find goalkeepers who prevent more expected goals, defenders who complete more blocks and clearances than your current backline or midfielders who complete more key passes per 90? If there are statistics recorded from matches for particular actions on the field, then the information in the Hub will inevitably unearth or highlight players who are good at these things.
I previously covered how to extract attacking and defensive insights when analysing your own team. The methods discussed here can show you how to potentially plug those gaps by identifying players who you know are already performing well in your division.
If the Team page > Defensive Actions zone map is telling you that a high percentage of your tackles are taking place in the area very close to your own goal line, why not pivot to the Player page > Midfielders – Tackling visualisation and hover to see which midfielders who play for your rivals have a higher attempted tackles and tackles won ratio than your current defensive midfield options.
If the Team page > Crossing scatter plot is showing your team as effective and accurate crossers of the ball, but the Headers Won plot shows your team as having a below average successful heading ratio, why not move to the Player page > Aerial – Forwards plot and look for strikers who are contesting as many or more headers than your attackers but winning a higher percentage of them?
This is certainly not the only way to scout and there’s no argument here for it being the best way. It’s simply an alternative route or another technique to have up your sleeve when trying to figure out how to improve your team and look for players who could help you do that.
Data alone cannot win football matches. There is no instant win formula in Football Manager, in the same way that the results of football matches in real life are truly unpredictable and based on intangible things like emotion and desire as much as they are on skill and technical ability.
That said, figuring out in a few clicks exactly where my strategy might have gaps and which domestic players may be best suited to fill them? That’s insight. That’s powerful. That’s realism.
What will you use your Data Hub for?
Happy managing,
FM Stag
Unlock early access to FM feature drops, news and reveals before anybody else. Plus, behind-the-scenes insights and incredible members-only giveaways.
Sign for FMFCAlready a member?
Don't Miss a Moment
Be the first to know what's next by following us across social media @FootballManager. Same handle, every platform.